Reading a Glucose Curve: The Nadir, the Duration and Stress Hyperglycaemia
Dr. Alastair Greenway
MRCVS
For most owners, a first glucose curve arrives as a column of numbers on a scrap of paper, or a wavy line on a phone app, and it can leave you feeling shut out of your own pet's care. Six readings, a squiggle, and the nagging sense that everyone but you knows which number matters. That sense is what I want to dismantle here, because reading a curve is a learnable skill, and an owner who can read their own pet's curve walks into the consult room with insight rather than just a spreadsheet.
This article teaches you to read a curve once you have one. Where the readings come from is someone else's territory, in home blood glucose monitoring and continuous glucose monitors; what to do with the dose afterwards belongs to insulin dose titration, because that is your vet's decision, never a guess at the kitchen table. Reading is yours; changing is a decision you make together.
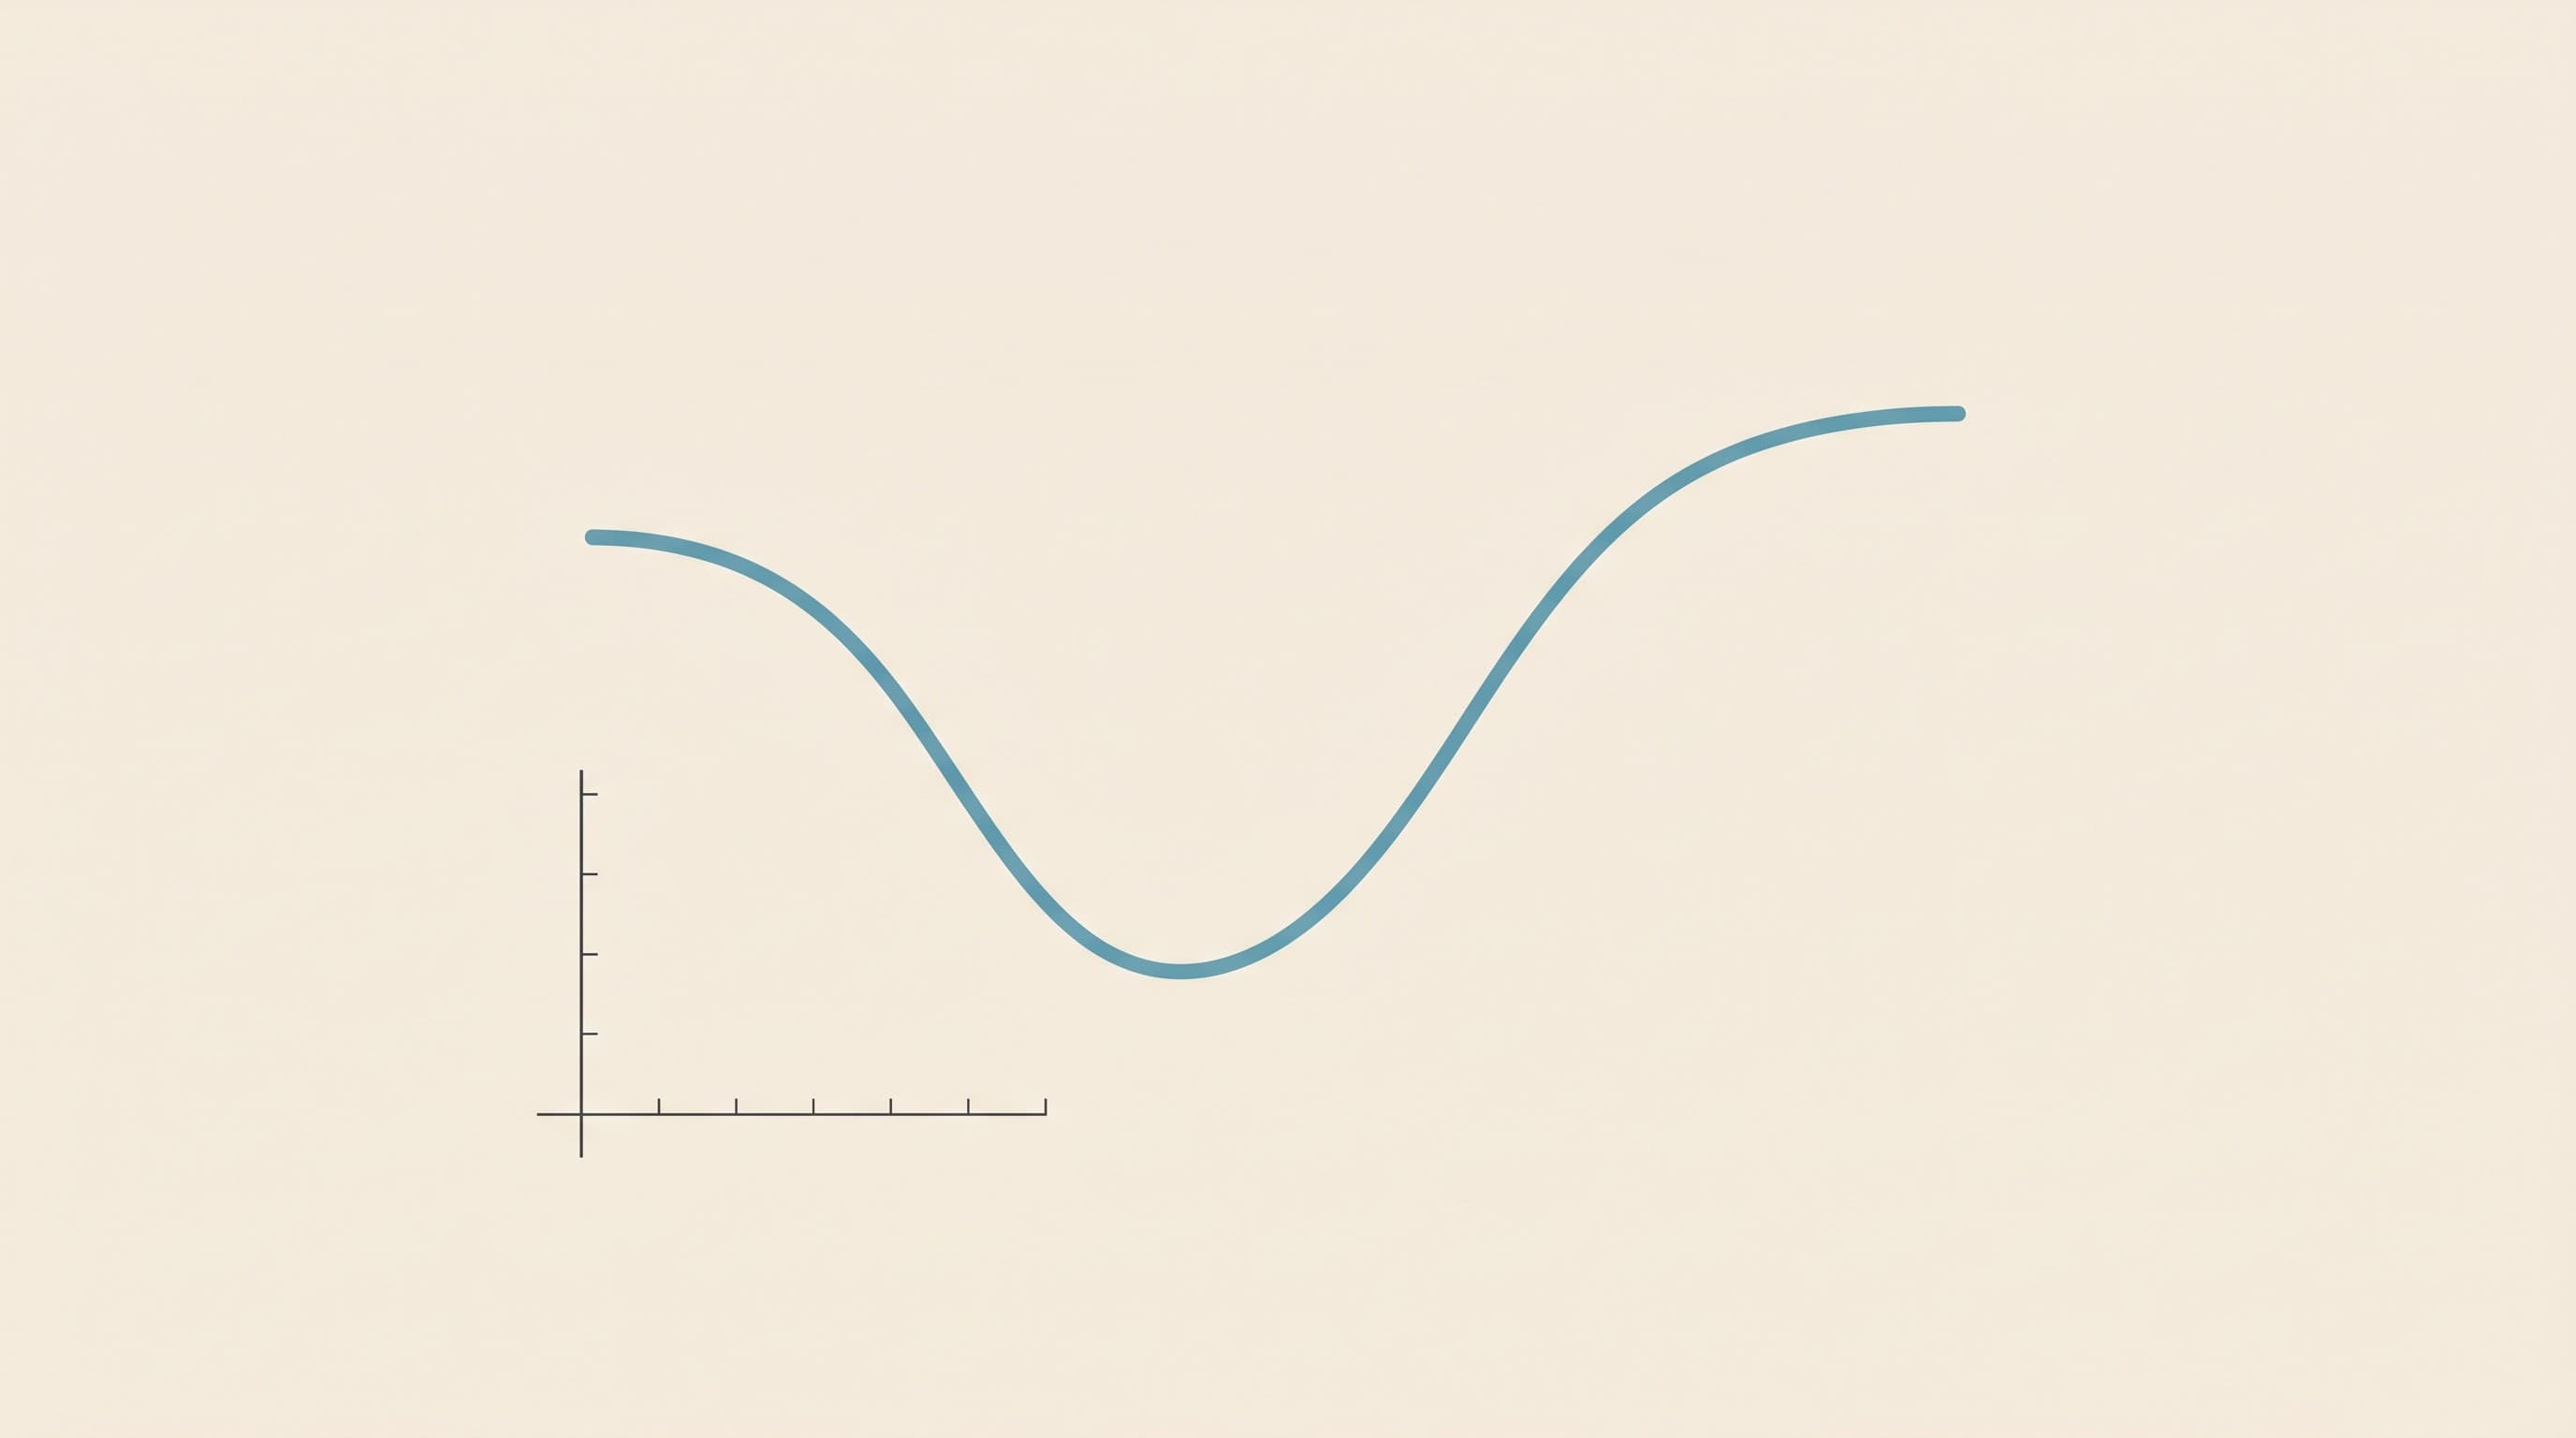
What a curve actually shows
A blood glucose curve is a series of readings taken across one dosing interval: a baseline first thing, just before the meal and the full insulin dose, then roughly every two hours for the ten to twelve hours until the next dose (Behrend et al., 2018). String the dots together and the line answers three questions at a glance: how low the glucose goes, when it gets there, and how long the insulin keeps it down before it climbs again (Behrend et al., 2018). A good curve is a gentle valley; a bad one is too deep, too shallow, or ends far too soon.
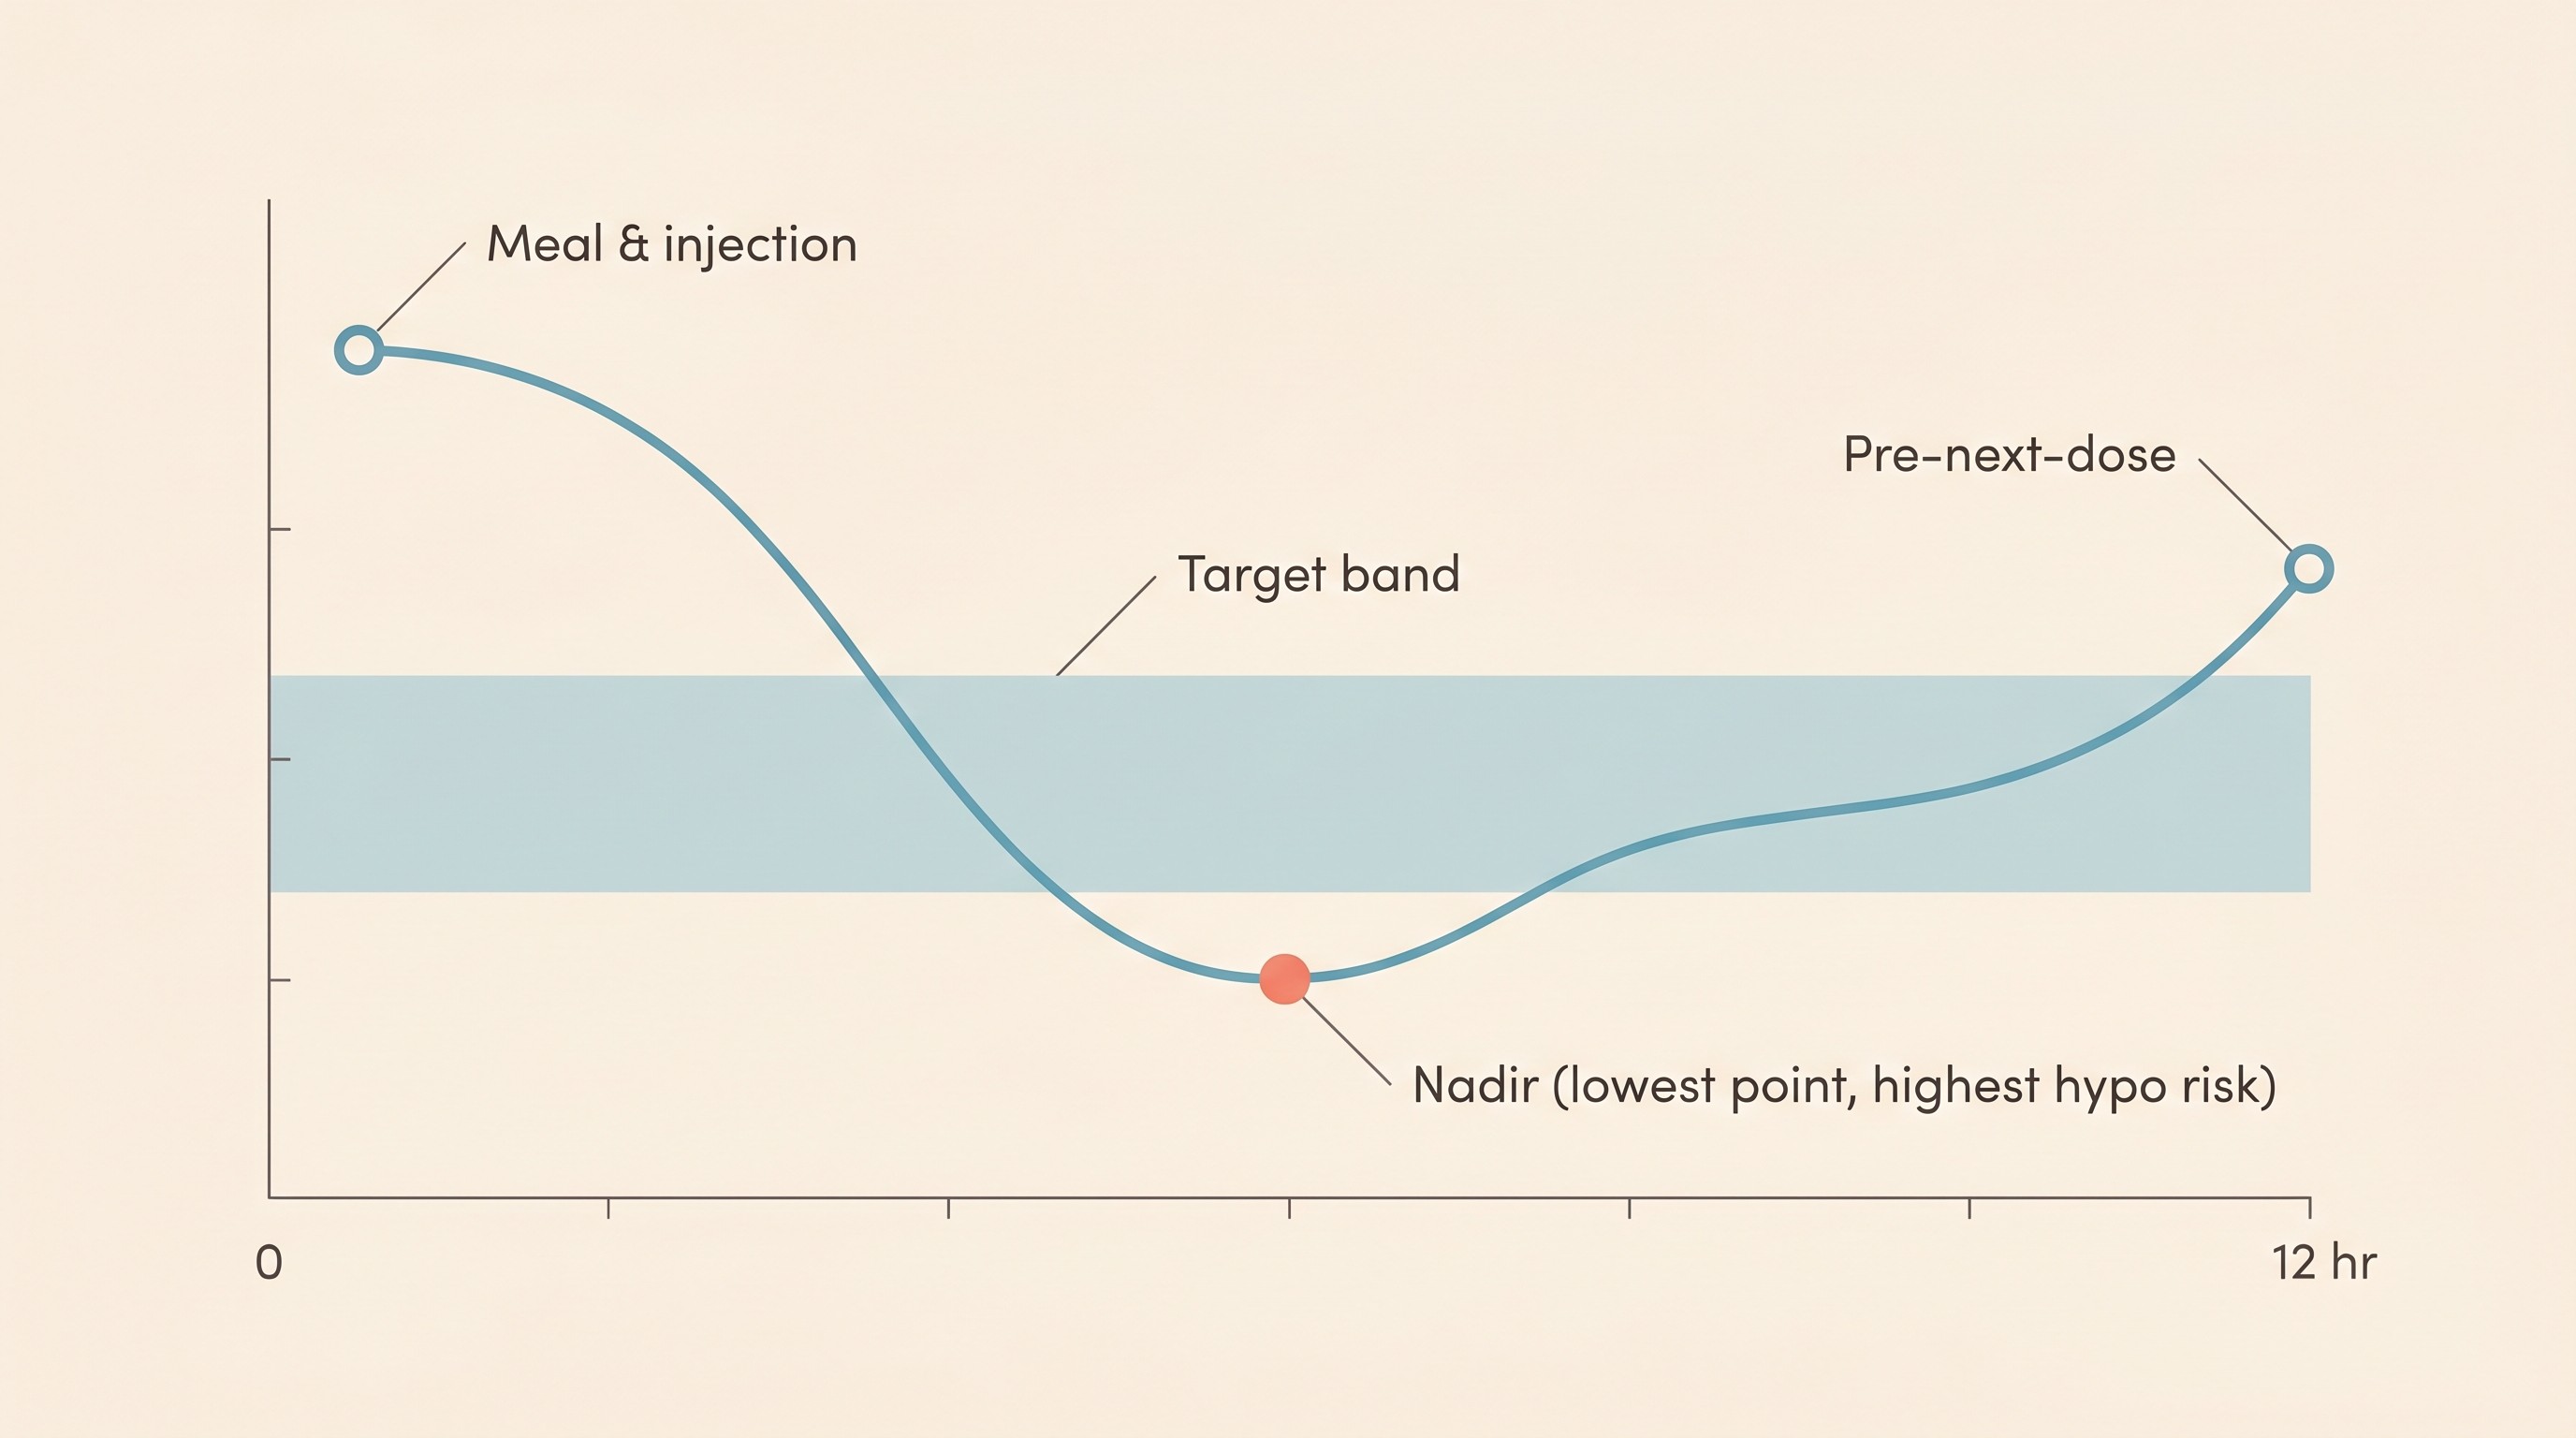
Start with the nadir
The nadir is the bottom of the valley, the lowest reading of the day, and it is the number I look at first on every curve. It matters more than any other point for two reasons: it tells you whether the dose is safe (too low a nadir means your pet has dipped close to a hypo, the emergency that actually kills diabetic pets), and it largely sets whether the dose is enough.
So what is "right"? The cross-species teaching target from the AAHA guidelines is a nadir of roughly 4.4 to 8.3 mmol/L (80 to 150 mg/dL) (Behrend et al., 2018). The current feline consensus runs a cat's ideal nadir a touch lower, around 4.5 to 5.5 mmol/L (80 to 100 mg/dL), with a higher ceiling, because a cat's diabetes and insulin behave differently from a dog's (Taylor et al., 2025). There is no single magic figure: the band is set by your vet, and what you are spotting is whether the bottom of the valley sits in a sensible range or worryingly below it. One caution carried from the kit article: a human glucometer reads a pet's blood low, so trust a pet-calibrated meter or sensor, not one borrowed from a diabetic person.
Peak and duration
The top of the curve matters too. The highest reading, usually just before the next injection, shows how high your pet swings and whether the insulin lasted the interval. AAHA puts a sensible peak close to 11.1 mmol/L (200 mg/dL) in dogs and 16.7 mmol/L (300 mg/dL) in cats, and the feline guideline runs the desired feline curve up to a peak of around 14 to 19 mmol/L (250 to 350 mg/dL) (Behrend et al., 2018; Taylor et al., 2025). Cats are allowed to run higher than dogs; that is not a typo, just the two-disease split showing at the top of the curve as well as the bottom.
This brings in duration of effect: how long the insulin keeps the glucose down before it wears off. Here is the bit that catches people out. You can have a textbook-perfect nadir and still have poor control if the duration is too short, because the line dips nicely, then climbs back up well before the next injection and leaves your pet hyperglycaemic for hours. That is a duration problem, not a dose problem, and pushing the dose up would only drag the good nadir into danger. The classic example is lente insulin such as Caninsulin in cats: the lente-insulin datasheet gives a duration of roughly 14 to 24 hours in dogs but only up to about 12 hours in cats, with the nadir arriving as early as four hours after injection (Caninsulin datasheet). The fix is a different insulin or interval, your vet's call through insulin types for dogs and cats; your job is to recognise the shape: nice dip, early climb, high before the next dose.
One clever wrinkle explains why your vet sometimes wants more than a single curve. If the glucose dips too low, below about 4.5 mmol/L (80 mg/dL), the body's counter-regulatory hormones (the same fight-back hormones that rescue a pet from a hypo) shove the glucose straight back up. That early rebound makes the insulin look as if it wore off sooner than it really did, so a dose that is genuinely too high can masquerade as a duration that is too short (Behrend et al., 2018). The true duration only becomes readable once the nadir is not being driven down into that rebound zone, which is exactly why a single curve can mislead and you cannot read one at face value and reach for the insulin pen.
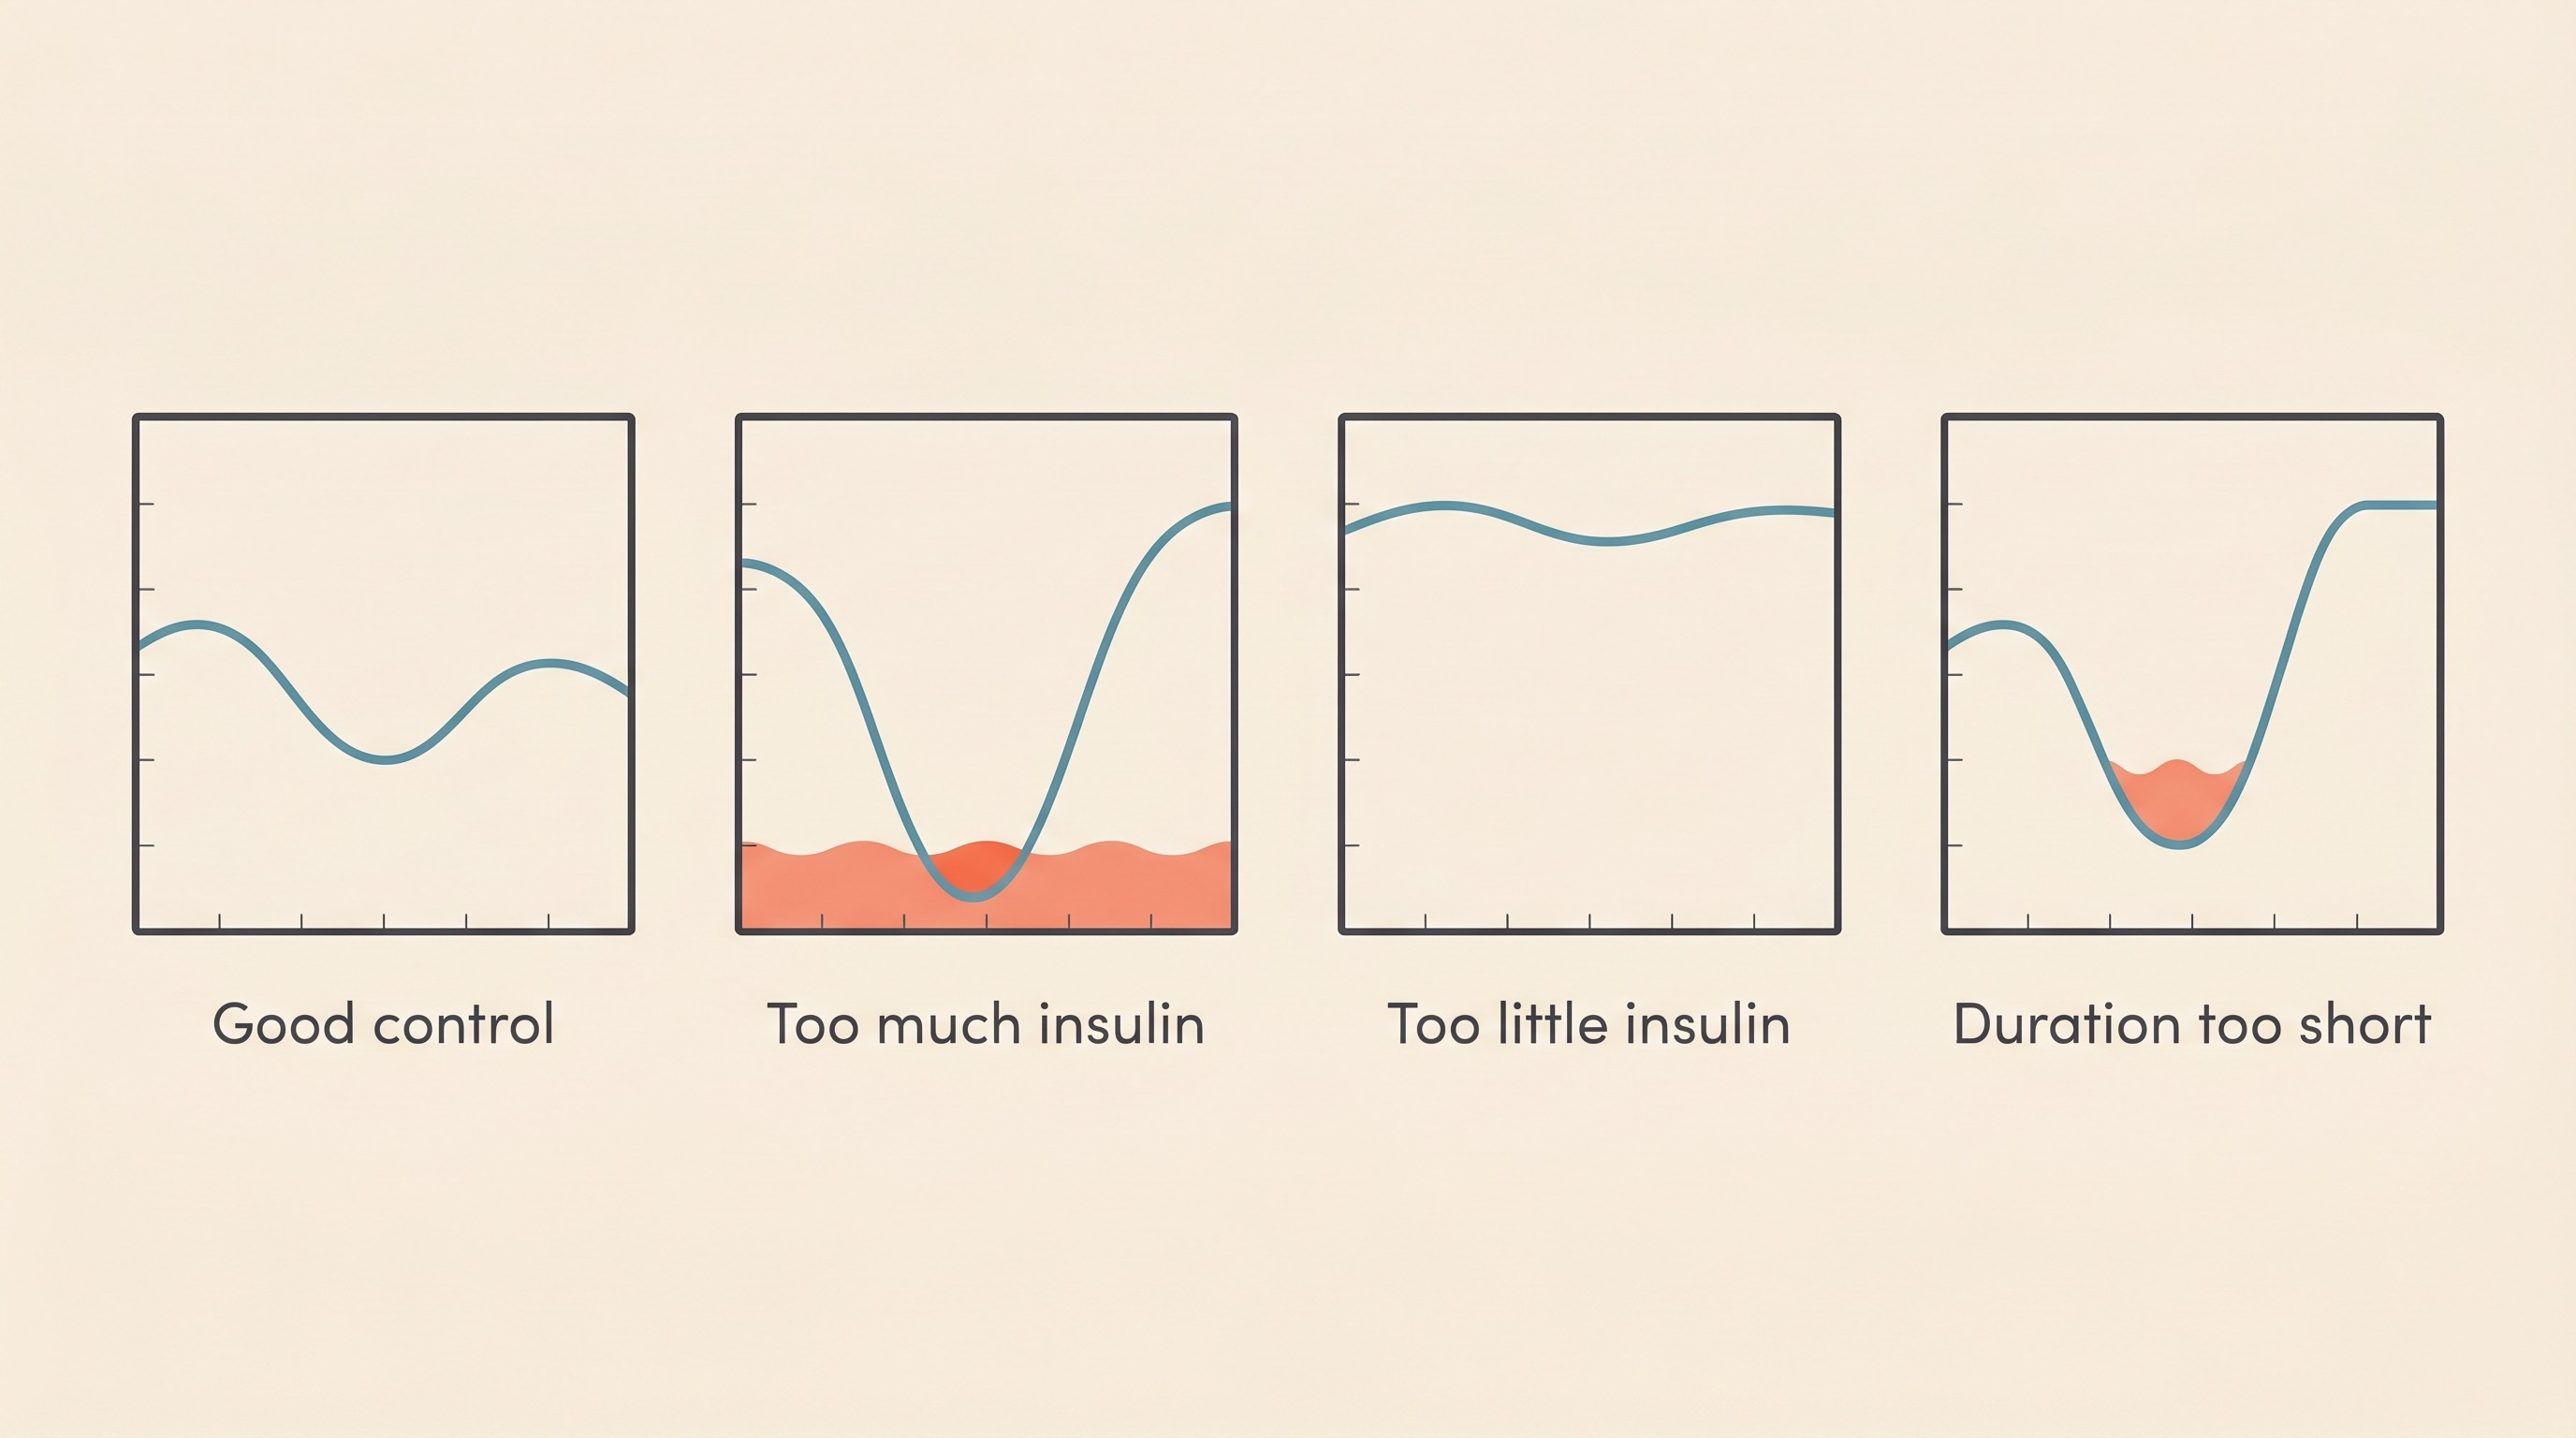
Four shapes worth recognising
Translate all of that into pictures and you get four shapes that cover almost everything you will meet. Naming them is the practical heart of curve-reading. One strict caveat: I am teaching you to recognise and log the shape, not to decide the dose change it calls for. That is your vet's decision, through insulin dose titration, every time.
- Good control. A gentle dip to a nadir inside the target band, then a climb back that does not go sky-high before the next dose (Behrend et al., 2018). A calm valley.
- Too much insulin. The dip goes too deep, below about 4.4 mmol/L (80 mg/dL), putting your pet at hypo risk, and the line may rebound high afterwards. Such a low can be completely silent, which is exactly why a curve catches what your eyes cannot (Behrend et al., 2018).
- Too little insulin. The line never really comes down, staying high all interval with only a shallow dip or no real nadir (Behrend et al., 2018; Del Baldo et al., 2025).
- Duration too short. A decent nadir, then a steep climb back to a high pre-dose value because the insulin wore off early (Caninsulin datasheet; Behrend et al., 2018).
A fifth pattern deserves a flag because the instinct it triggers is so wrong: a low nadir followed by a high, often a deceptively high morning reading after an unseen overnight dip, where the high is actually driven by a hidden low that more insulin would only deepen. Be proportionate, though, because this rebound is now known to be uncommon and was historically over-diagnosed, appearing in only about 0.42% of curves in cats on glargine under tight control, and insulin must never be cut without a curve or sensor actually showing the preceding low (Roomp & Rand, 2016). The curve is simply how you catch it, or rule it out; the full story lives in the Somogyi effect and dose-chasing.
Stress hyperglycaemia: the falsely high cat
If you have a cat, this can rescue you from a genuinely harmful misreading. A frightened cat manufactures its own high glucose, so a single high in-clinic reading, or an entire in-clinic curve, can be falsely elevated by stress alone and does not prove poor control.
The numbers are striking. In a controlled study, struggling and restraint raised cats' glucose from a baseline mean of 4.6 mmol/L (83 mg/dL) to a mean peak of 9.0 mmol/L (162 mg/dL), higher still in some individuals, driven by surges of lactate and noradrenaline (Rand et al., 2002). The feline guideline adds the caveat that stress hyperglycaemia "can be of any magnitude," so there is no clean threshold above which a high reading is certainly diabetes rather than fear (Taylor et al., 2025). A clinic curve can therefore paint a picture of terrible control that simply is not true, which is why a curve gathered at home, reflecting the disease and not the day out, is worth so much more. This article owns stress hyperglycaemia purely as a curve-reading trap; why it complicates diagnosis sits in diagnosing diabetes in pets, and the feline biology in feline diabetes explained.
Time-in-Range: the modern read
A continuous sensor turns that handful of dots into a flowing trace, and with it comes a truer measure: Time-in-Range, the percentage of the day the glucose sits inside target. In the first proper canine dataset, that range was 3.9 to 13.9 mmol/L (70 to 250 mg/dL), and dogs judged to have good control had a median Time-in-Range of 49.5% against 35.0% for poorer control (Del Baldo et al., 2025). Notice the target is not "perfect numbers all day": even good control sits in range only about half the time, which is worth remembering before you despair at your own pet's figures.
Why does a continuous trace beat a string of spot readings? In that same study, continuous monitoring found the true nadir in 79% of cases against just 41% for intermittent checks, and picked up hypoglycaemic episodes in 60% against only 9% (Del Baldo et al., 2025). A handful of dots, however careful, misses most lows and often the real bottom of the valley. What a sensor is and how to keep it on belongs to continuous glucose monitors; here I am just reading the trace as the modern curve.
One caveat must be carried into how you read a sensor, because it touches the hypo emergency directly. Interstitial sensors are least reliable exactly where it matters most, in the low range and when glucose is changing fast: in cats the FreeStyle Libre tended to under-read through most of the normal range but over-read in marked hypoglycaemia, and it lags blood by roughly five to twelve minutes, staying clinically reliable across the sensor generations even when it is not analytically perfect (Berg et al., 2023; Tardo et al., 2025; Today's Veterinary Practice). The rule ties straight to the hypo guardrail: treat your pet and the trend, not a single sensor dot. If a sensor flashes a surprising low but your pet is bright, confirm it with a quick blood prick before acting. If your pet is wobbly, weak, dull or trembling, that is an emergency now: rub glucose or honey on the gums (never pour liquid into a pet that cannot swallow) and ring your vet (the full rescue is in the hypoglycaemia guide). Never re-dose insulin into a suspected low.
Where it all funnels
A curve is a snapshot of a single day, and days vary. Its perfect complement is fructosamine, the blood test that reflects the average glucose over the preceding seven to ten days or so, cutting through daily noise and, crucially for the stressed cat, immune to a single fear-driven spike (Taylor et al., 2025). I will leave the detail to fructosamine and the vet rechecks; just hold it as the steady weeks-long companion to the curve's single day.
So here is what to carry off this page. Every curve must be read in the light of how your pet actually is, so react to trends and clinical signs, never a single number, and never self-adjust insulin without a plan agreed with your vet (Behrend et al., 2018). Log your readings, from a meter or a sensor, in the Glucose Companion, which plots the curve, marks the nadir, flags a low and produces a clean report for your vet. The point of learning to read a curve was never to dose your own pet. It was to arrive at the consult able to say "the nadir's been sitting low and the line climbs early before the evening dose," instead of "I think the numbers are a bit funny." That sentence, backed by a plotted trend, is what gets your pet to good control faster, so take it to your vet and let the dose adjustment be the conversation you have together.
References
- Behrend E, Holford A, Lathan P, Rucinsky R, Schulman R. 2018 AAHA Diabetes Management Guidelines for Dogs and Cats. Journal of the American Animal Hospital Association. 2018;54(1):1-21.
- Taylor S, Cannon M, Church D, Fleeman L, Fracassi F, Gilor C, Mott J, Niessen S. 2025 iCatCare consensus guidelines on the diagnosis and management of diabetes mellitus in cats. Journal of Feline Medicine and Surgery. 2025;27(11):1098612X251399103.
- Rand JS, Kinnaird E, Baglioni A, Blackshaw J, Priest J. Acute stress hyperglycemia in cats is associated with struggling and increased concentrations of lactate and norepinephrine. Journal of Veterinary Internal Medicine. 2002;16(2):123-132.
- Del Baldo F, Tardo AM, Gilor C, et al. Freestyle Libre-derived metrics in assessing glycemic control in diabetic dogs. Journal of Veterinary Internal Medicine. 2025;39(4):e70151.
- Berg AS, Crews CD, Adin C, et al. Assessment of the FreeStyle Libre 2 interstitial glucose monitor in hypo- and euglycemic cats. Journal of Veterinary Internal Medicine. 2023;37(5):1703-1709.
- Tardo AM, Crews C, Mott J, Porter LT, Adin C, Gilor C. Accuracy of the FreeStyle Libre 3 continuous glucose monitoring system in hypo- and euglycemic cats. Journal of Veterinary Internal Medicine. 2025;39(2):e70048.
- MSD Animal Health. Caninsulin / Caninsulin Vetpen (porcine lente insulin, 40 IU/mL): product information and FAQ.
- Roomp K, Rand JS. Rebound hyperglycaemia in diabetic cats. Journal of Feline Medicine and Surgery. 2016;18(8):587-596.
- Continuous glucose monitoring in veterinary patients. Today's Veterinary Practice.
Keep track of how your pet is doing
The owners who cope best are the ones who notice changes early. A simple health log shows you what is working, and what is not, before the next vet visit.
Start tracking, freeYou're not doing this alone
Compare treatment journeys and talk to owners managing diabetes mellitus. Free to join.
Join PetsLikeMine