Growth charts and a healthy weight for young pets
Alastair Greenway
BVM&S MRCVS
Somewhere in the first few months, almost every new owner asks the same quiet question. Is my puppy the right size? Is my kitten too small, or is that a bit of a belly? You compare them to the littermate photos on the breeder's page, to the dog in the park who is the same age but twice the size, to a stranger's kitten on the internet, and you come away no wiser. When you ask out loud, the answer is often a cheerful "oh, he'll be fine", which is kindly meant but tells you nothing you can act on.
Here is the better question, and the one this article answers. Not "is my pet the right size today?" but "is my pet growing along the right shape?" Because it turns out we can measure that properly, against real curves built from tens of thousands of animals, in almost exactly the way a health visitor plots a baby in the red book. That shape, traced week by week across the first year, tells you more than any single number on the scales ever could, and it quietly sets your pet up for a healthier decade.
Why the first year matters more than it looks
It is tempting to think of puppyhood and kittenhood as a size problem: get them from small to full-grown, feed them well, job done. The reason vets fuss about it is that the first year is not just when your pet gets big. It is when the risk profile for a lot of their adult life is being laid down.
Two things in particular are decided early. The first is weight. A puppy or kitten that carries too much condition while growing is far more likely to become an overweight adult, and being overweight is the single most common preventable health problem we see, tangled up with joint disease, diabetes in cats, breathing trouble and a genuinely shorter life. A landmark long-term study of Labradors found that dogs kept lean lived meaningfully longer than their overfed littermates and developed osteoarthritis later. Puppy fat is not harmless, and it does not simply melt away.
The second is the skeleton, and this matters most in large and giant-breed dogs. Bones and joints grow fastest in the first months, and pushing that growth too hard, usually by overfeeding, is linked to developmental orthopaedic disease. Growing steadily is protective. Growing too fast is a risk you cannot take back later. This is why "get him big quickly" is one of the few pieces of well-meaning advice we will actively ask you to ignore.
So the honest reason to track growth is not vanity or reassurance. It is that the trajectory itself is the health signal, and it is the one you can see coming.
How growth charts actually work
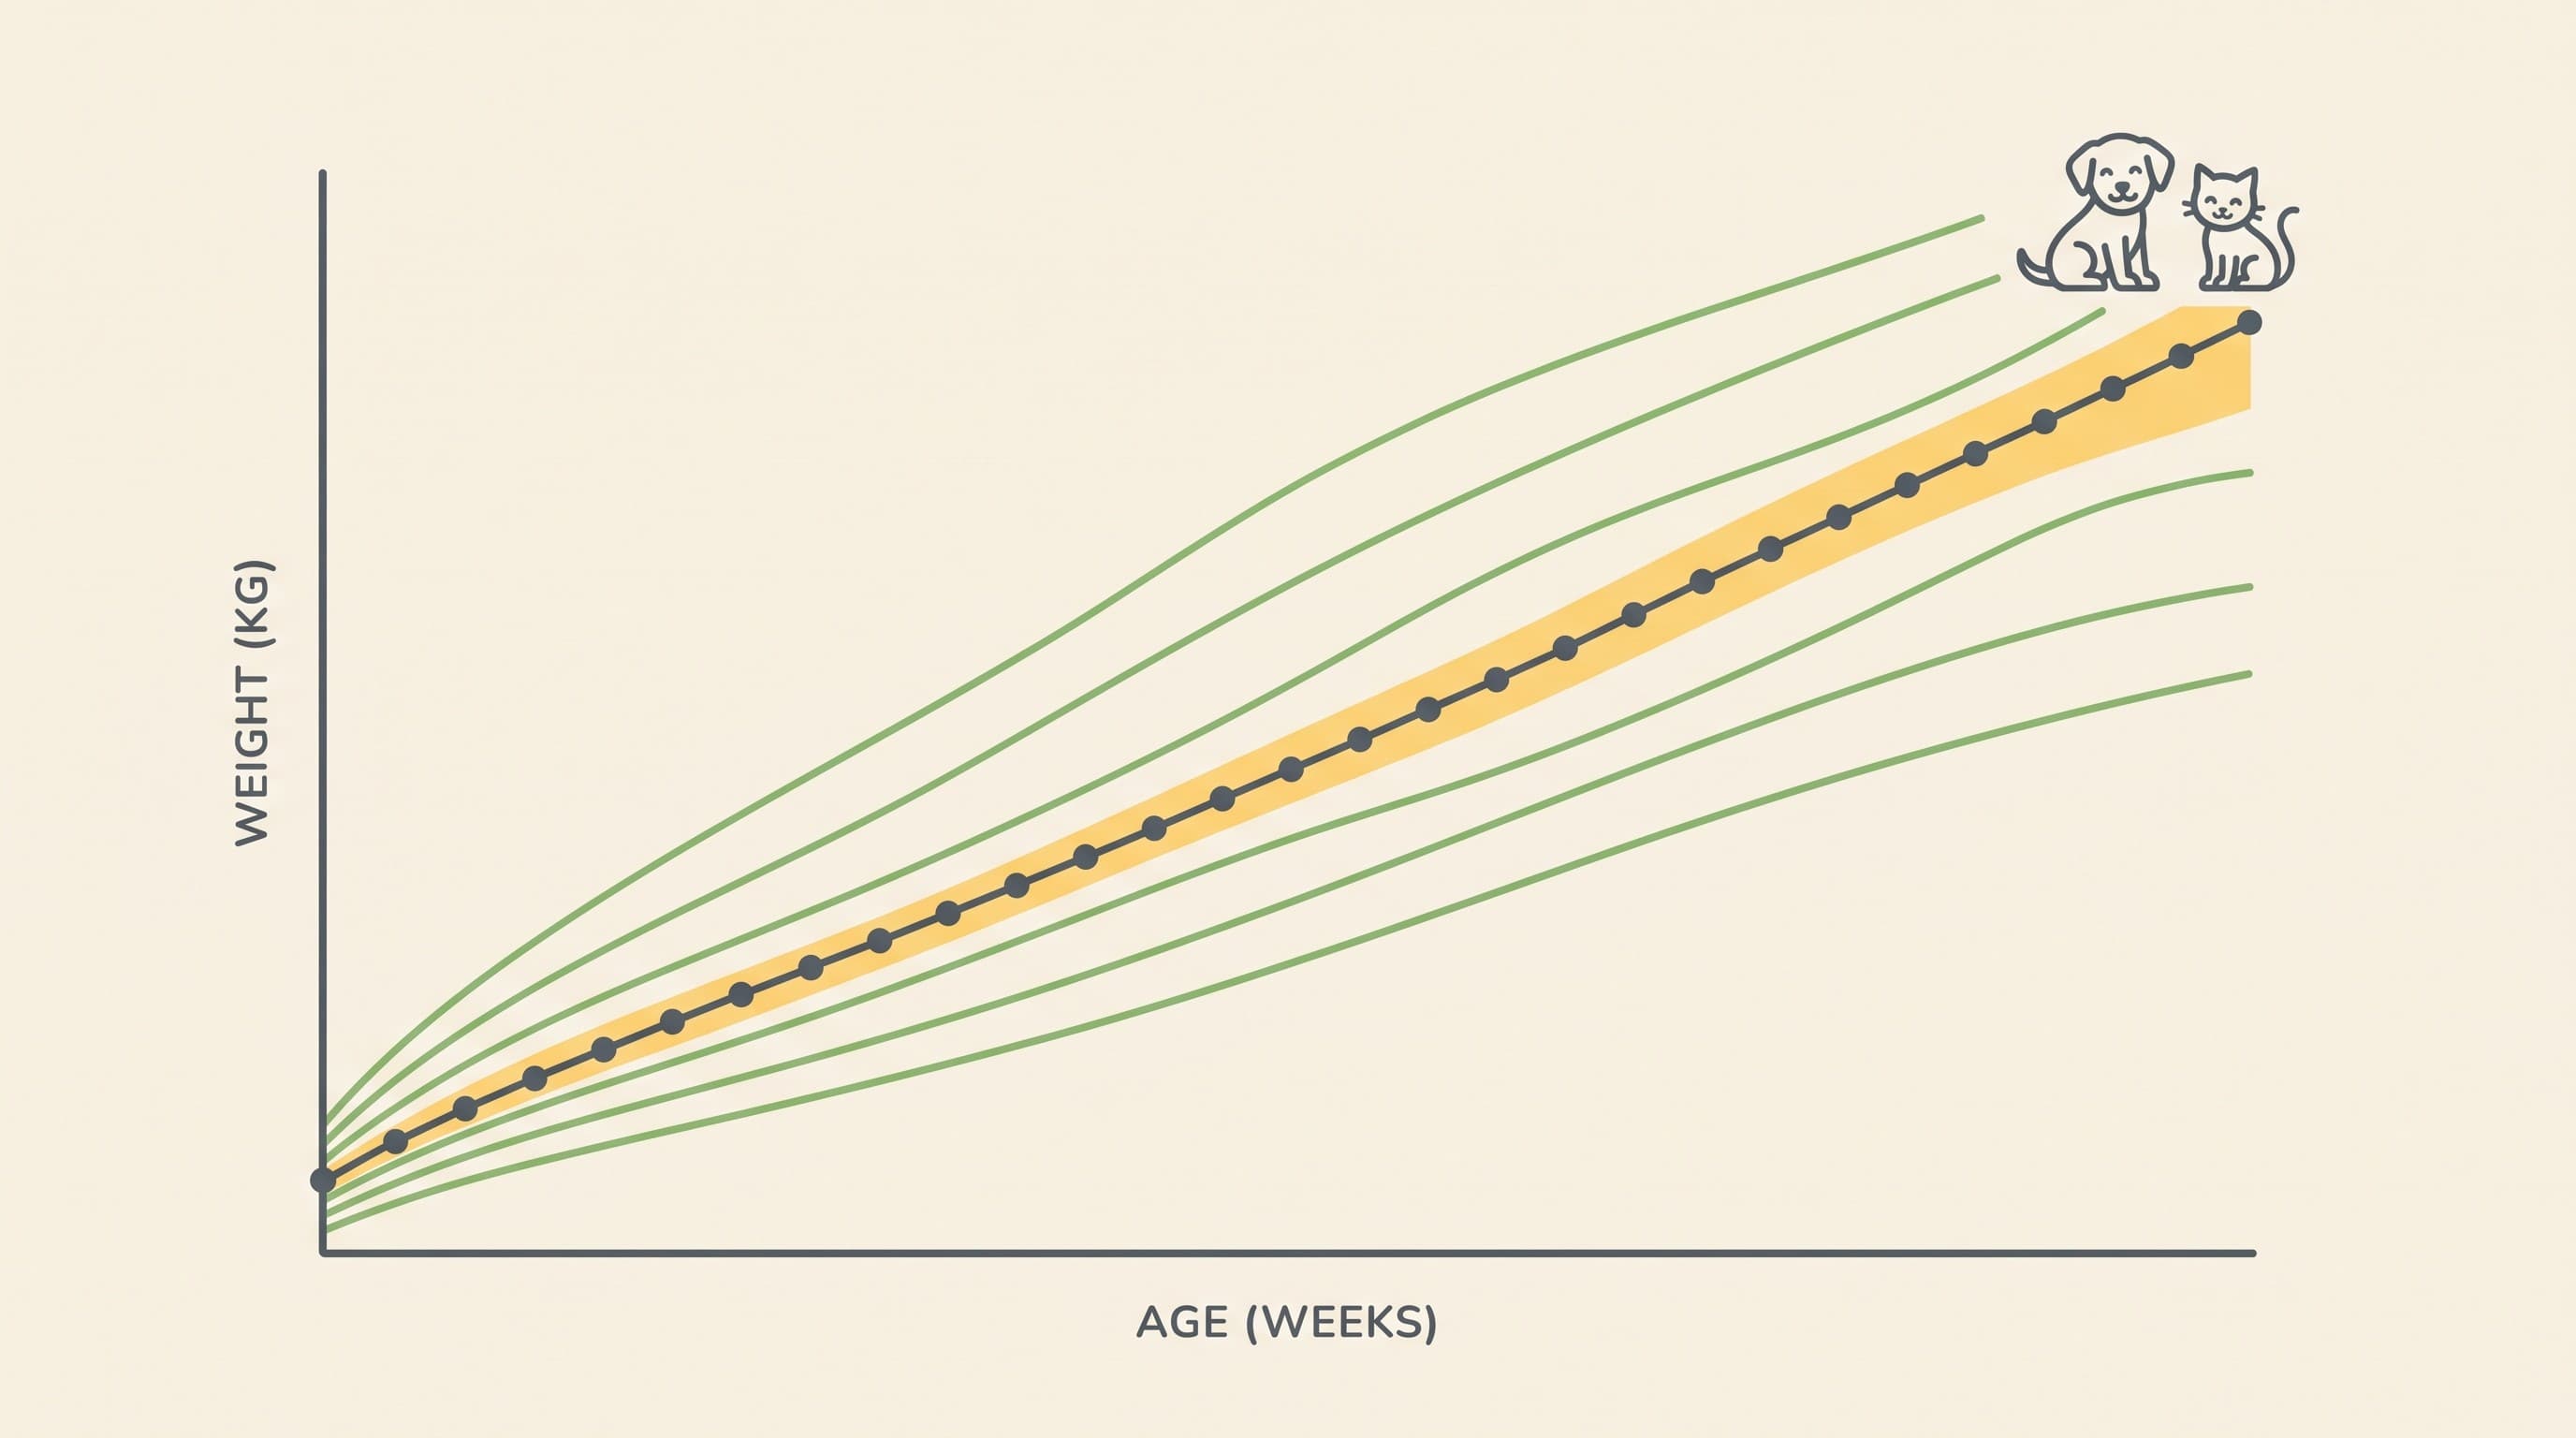
You may already know how a baby's growth is plotted. The nurse marks weight against age on a chart printed with a fan of curved lines, the centiles. A baby on the 50th centile is bang in the middle of the population. One on the 9th is small but perfectly healthy if they stay on the 9th. What worries a health visitor is not a low line, it is a baby who was tracking the 50th and suddenly drops to the 2nd, or climbs steeply across the lines. The shape of the curve matters more than the single point.
Puppies and kittens can now be read the same way. The WALTHAM Petcare Science Institute built puppy growth charts from a very large dataset (Salt et al., 2017, PLOS ONE, drawing on records from around 50,000 dogs), producing sex-specific centile curves grouped by adult size band, from toy through to giant. Kitten growth charts followed using the same centile approach (published in PLOS ONE, 2022). These are not rules of thumb or breed-average tables. They are population percentile curves, the closest thing we have to a red book for pets.
To use them you need three things: your pet's sex, an idea of their expected adult size band (for a crossbreed or a rescue this is a best estimate, and that is fine), and a run of accurate weights over time. Plot those weights and you get a line. A healthily growing pet follows a centile, tracking roughly parallel to the printed curves as they climb. Where their line starts is far less important than whether it holds its shape.
What the shape of the line is telling you
Once you can see the line, two patterns are worth watching for. Neither is a diagnosis. Both are simply a nudge to pick up the phone to your vet.
The first is crossing centiles upwards, where the line climbs steeply across the printed curves rather than running parallel to them. In a growing pet this usually means over-nutrition: more calories going in than the body needs to grow at a healthy rate. It is the earliest, clearest warning of the puppy or kitten obesity that so often becomes adult obesity, and in a big-breed pup it is also the pattern linked to too-fast skeletal growth. Catching an upward drift at four months is a small conversation about portions. Catching it at four years is a hard weight-loss programme.
The second is crossing centiles downwards, where the line flattens or drops away from where it was tracking. This can be as simple as a growth check that will correct itself, but it can also flag under-nutrition, a heavy worm burden, or an illness that has taken the wind out of them. The key point, and the one that trips people up, is that a pet dropping down the curve does not automatically need more food. If they are unwell, more food is not the answer, and piling in calories can mask something that needs treating. A downward drift is a "show your vet" signal, not a "feed more" signal.
A steady line that holds its centile, whatever centile that is, is the reassuring picture. A small dog destined to be small and a large dog destined to be large can both be perfectly healthy. It is the change in direction that earns a phone call.
The large-breed twist: faster is not better
If you have a Labrador, a German Shepherd, a Rottweiler, a Bernese Mountain Dog or any of the big and giant breeds, this section is the one to hold on to. With a small dog, feeding a touch generously mostly risks a bit of extra weight. With a large-breed puppy, pushing growth too fast is an orthopaedic risk in its own right, because the skeleton is being asked to build quickly under a load that is climbing quickly.
The instinct to grow a big-breed pup "up to size" as soon as possible is exactly backwards. The aim is a steady, unhurried climb along a lower-to-middle centile, reaching full size a little later rather than a lot sooner. This is also why large-breed puppy diets exist and matter, a point covered properly in the piece on feeding a puppy or kitten, and why the breed lens is worth a look early: your dog's breed page flags the joint and growth issues worth watching from the start, so the record begins knowing what to keep an eye on.
For giant breeds especially, growth continues for much longer, which is one of the threads that runs into the neutering decision too, since timing that around skeletal maturity is part of the same picture (when to neuter your dog).
Doing it properly: the Growth Curve Tracker
You can plot all this on paper, and if you like graph paper, please do. But the reason we built the Growth Curve Tracker is that a weekly weigh-in is one of the few genuinely useful things you can do at home that a training app simply cannot fake, and it deserves to be effortless.
The routine is small. Once a week, weigh your pet (for a puppy or kitten, standing on the bathroom scales while you hold them, then weighing yourself and subtracting, works well until they are big enough to weigh alone), and pop the number in. The tracker plots it on the right WALTHAM-methodology centile curve for your pet's sex and size band, joins the dots into their line, and tells you plainly whether they are tracking steadily or drifting across the curves. When you next see your vet, you can export a clean, dated chart rather than trying to remember "he was about, ooh, four kilos-ish last month?"
There is a bigger point here than tidy record-keeping. That weekly weight series is the spine of your pet's lifetime record. The line you start in the first year does not stop at adulthood. It flows into the Weight Management space if condition ever needs watching, it gives context to joint-risk conditions like arthritis and cruciate disease down the line, and it eventually becomes part of the vitality picture the Senior Pets space draws on at the far end of your pet's life. You are not just checking a puppy. You are opening the file that every later chapter reads from.
The scales tell you half the story
One honest limitation. A weight and a centile tell you the trajectory, but they do not tell you whether the weight your pet is carrying is muscle, frame or fat. A number can look reassuring while a pet is actually a little soft over the ribs, and a lean, well-muscled pup can look "underweight" on paper when they are in ideal condition.
That is why the weigh-in has a partner: the hands-on check known as body condition scoring, where you feel the ribs, waist and tummy tuck to judge condition directly. It takes thirty seconds and it catches what the scales miss. The two together, the objective line and the hands-on read, are what your vet actually uses, and both are covered in body condition scoring: the hands-on check that beats the scales. Do them side by side and you have the full picture.
What to do this week
Start the line. Weigh your puppy or kitten, note the date, and put it into the Growth Curve Tracker so you have a first point on the curve. Do it again next week. Within a month you will have a shape, and a shape is something you can actually read.
And keep the last word honest: a growth chart is a brilliant conversation-starter, not a diagnosis. It is designed to tell you when the trajectory is worth a chat, so you take a real, dated line to your vet instead of a vague worry. If the line climbs or drops across the curves, that is your cue to ask, not to change the food on a hunch. Paired with the hands-on check and read alongside the feeding guide, it turns "is my pet the right size?" into something you can finally answer with your own eyes.
References
- Salt C, Morris PJ, Wilson D, Lund EM, German AJ. Growth standard charts for monitoring bodyweight in dogs of different sizes. PLOS ONE. 2017;12(9):e0182064.
- WALTHAM Petcare Science Institute. Puppy Growth Charts (and Kitten Growth Charts).
- ⚠️ IP note for integrator: WALTHAM centile methodology is open-access, but confirm WALTHAM attribution terms or reconstruct curves from published percentile data before shipping branded charts.
Keep track of how your pet is doing
The owners who cope best are the ones who notice changes early. A simple health log shows you what is working, and what is not, before the next vet visit.
Start tracking, freeYou're not doing this alone
Compare treatment journeys and talk to owners managing new puppy & kitten. Free to join.
Join PetsLikeMine